CLIMATE CHANGE
Let’s Take a Closer Look
Chugach Region Climate Stripes, 1900-2022
No words. No numbers. No graphs. Just a series of colored bars.
These “climate stripes” are visual representations of temperatures in the Chugach since 1900. Each band represents the average temperature for a single year, relative to the average temperature from 1900 to 2022. The shade corresponds to the rank of each year from coldest—dark blue—to warmest—bright red. The warming trend in the Chugach is remarkable. The numerous and consistently bright red stripes on the right show the undeniable warming trend in the Chugach region over the past three decades.
DATA SOURCE: analyzed and provided by Rick Thoman from the Alaska Center for Climate Assessment and Policy
7 Generations of Change StoryMap
Human Experiences of Climate Change in the Chugach region
This online tool showcases generations of change in the Chugach, beginning with Lily, a youth from the Chugach region. Learn about local environmental impacts, shifts in temperature, changes in subsistence resources, and more through the story of Lily, her ancestors, and her descendants.
This StoryMap is a resource to share information about local climate impacts, provide downscaled models of climate change to help inform future planning, and to put a human and environmental face to this data to tell the story of how climate change is impacting our region.
Abiotic Effects
of Climate Change
in the Chugach region
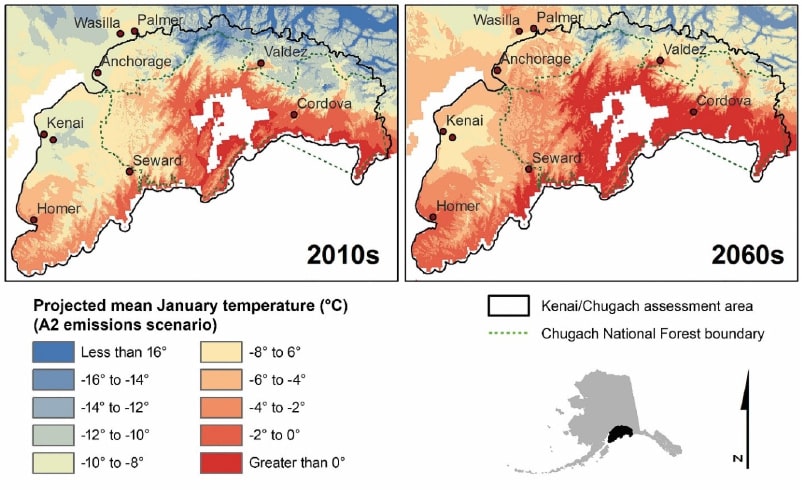
Higher latitudes are warming at a faster pace than the global average, and the Chugach region is no exception. Already, temperatures in the Chugach have climbed 0.7 degree C above their historical average over the last century, with some winter months seeing much higher average warming. January and February have both increased 1.7 degrees C on average over the last century. In the future, temperatures are expected to continue to warm, especially in winter, with average winter temperatures moving from below freezing to above freezing throughout much of the region.
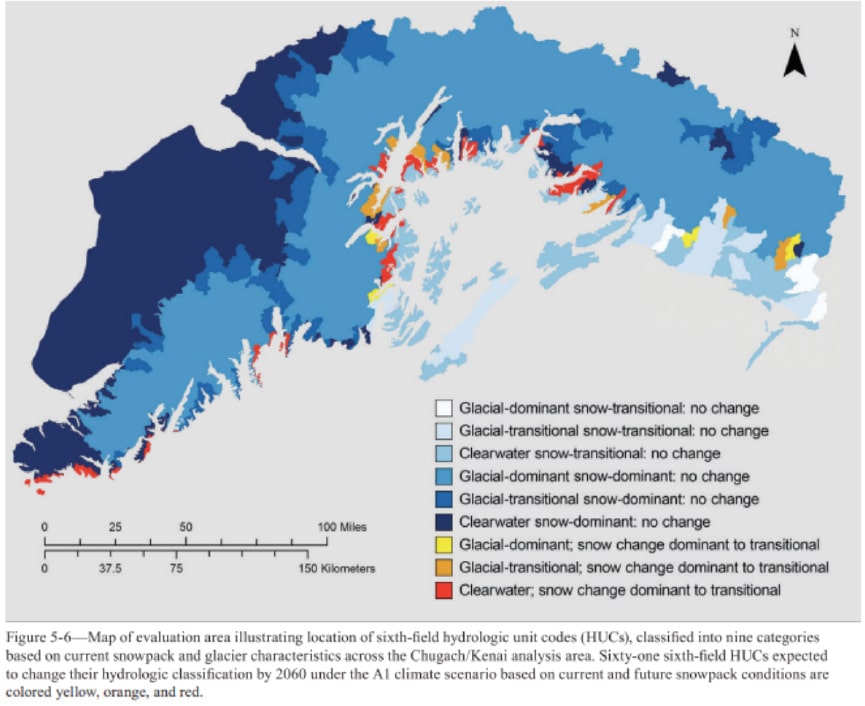
Precipitation is more variable in the current climate models, though there is the potential for a slight increase in precipitation, particularly in winter and spring throughout the region. Climate models indicate a likelihood of increased storm activity and intensity and a shift from snow-dominated landscapes to rain-dominated landscapes, particularly in coastal areas. This would create a marked shift in the current hydrological cycle
For more details about what climate models say about potential temperature, precipitation, permafrost, and wildfire changes in our region, see the University of Alaska Fairbanks’s Northern Climate Reports. You can search by community or for the Chugach National Forest region at the link below.
Effects of Climate Change & Ocean Acidification
Ocean acidification threatens many of the ecosystems and resources upon which Chugach Tribal Members depend. Colder waters accumulate more carbon dioxide than warmer waters, making our oceans more acidic than the global average. Worldwide, oceans have increased in acidity by 30 percent over the last 250 years as they absorb carbon dioxide from the atmosphere, and future projections show a potential annual increase of 0.5 to1% in acidity.
Currents, freshwater input, and tidal movement cause wide variability in local levels of ocean acidification in Southcentral Alaska, but levels have been steadily increasing over time. Ocean acidification has many impacts on traditional foods, particularly shellfish, as carbon dioxide creates carbonic acid in water, which binds with the carbonate ions shellfish need to produce shells. More information about ocean acidification can be found on the APMI website.
Isostatic Rebound
Post-Glacial Melt
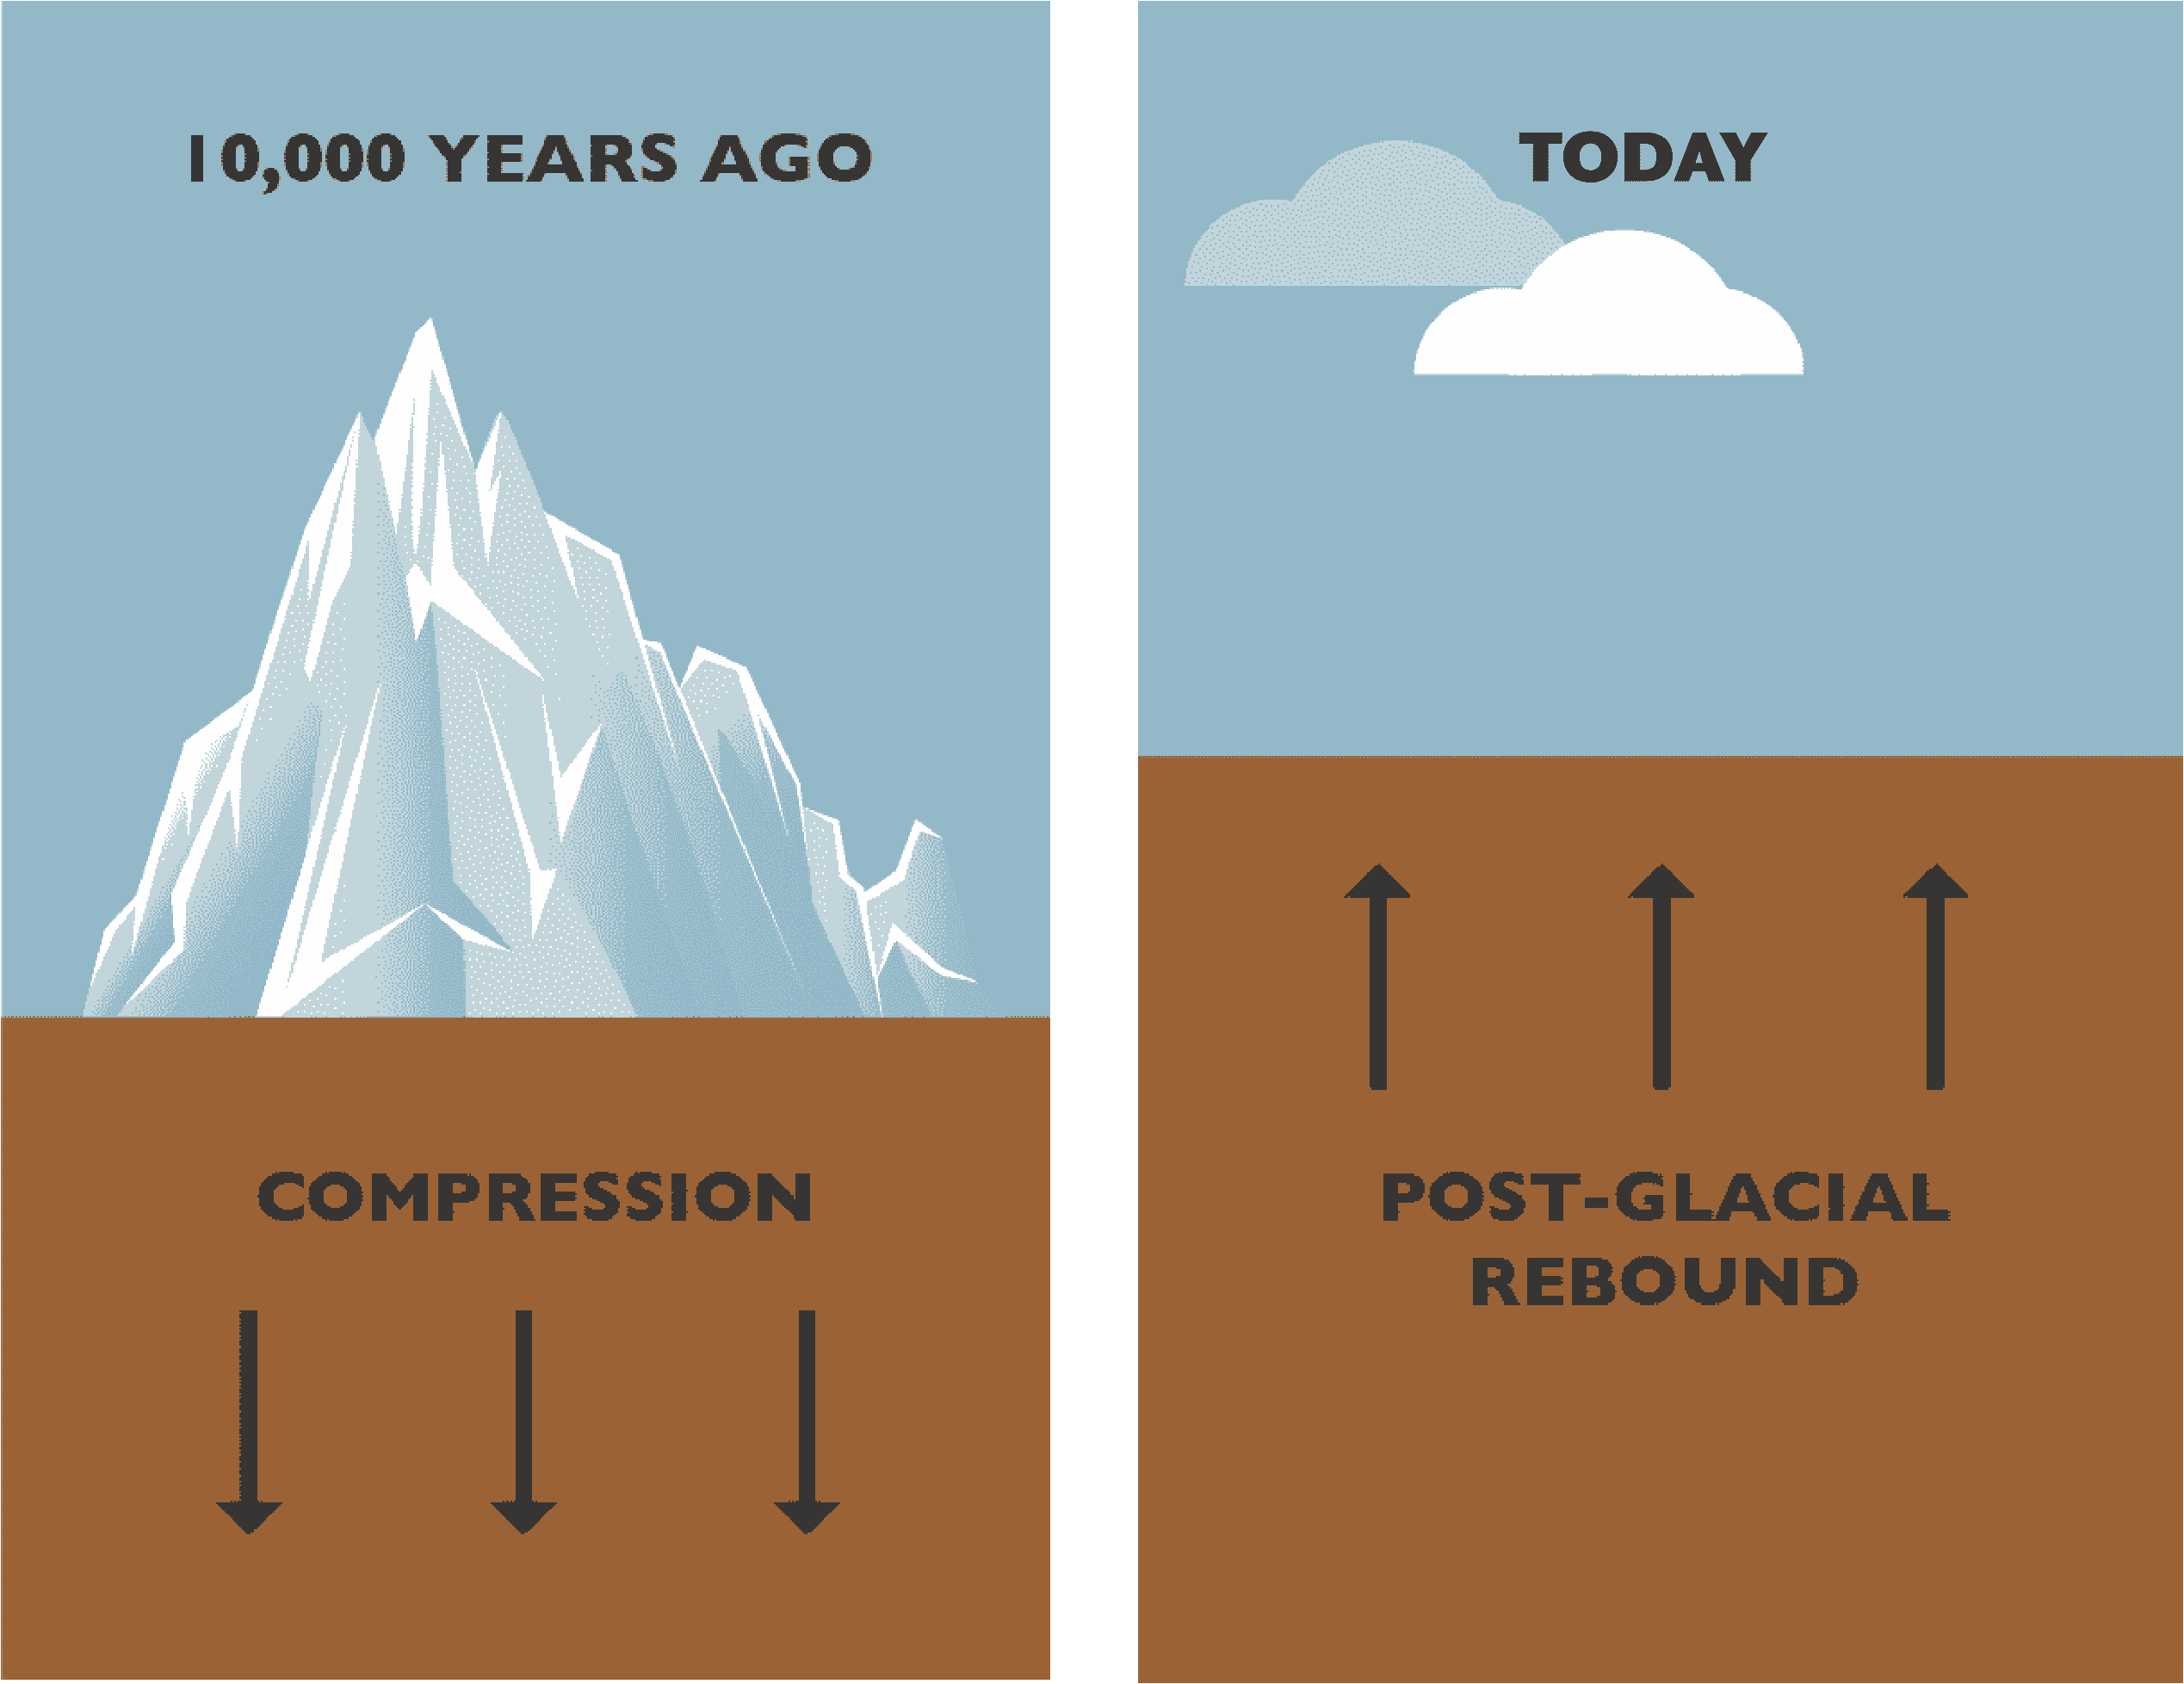
Unlike other parts of Alaska and the United States, sea level rise is not generally a concern for the region. Isostatic rebound is causing the local sea level to decline by about 1 cm (about 0.39 in.) annually. Despite this, residents in communities have reported higher tides and ocean flooding occurring more often than in the past, possibly due to storm surges from more intense storms. More storms and wetter years can also lead to more erosion and landslides, threatening homes, lives, and vital infrastructure and supply lines. Local changes to ocean level can also significantly alter ecosystems, especially wetlands and tidal flats like the massive Copper River Delta outside Cordova.
Climate Change Impacts on Traditional Livelihoods
In 2019, CRRC began a vulnerability assessment of how climate change has and will affect the Chugach region, emphasizing the impacts on natural resources and traditional foods. In 2020, CRRC held three in-person community meetings and an online survey to ask Tribal Members about climate risks to traditional foods and the impacts that changes to those foods would have on their lives and livelihoods. More details can be found in the report, Climate Vulnerability of Traditional Resources in the Chugach Region.
CRRC was also asked to develop a chapter for the US Forest Service as a follow-up to the 2017 Chugach National Forest Vulnerability Assessment that looked at the region’s human dimensions of climate change. CRRC contracted with Dr. John Morton to look at climate impacts on select traditional foods and resources in the region and how climate change could impact subsistence resources.


