

CLIMATE CHANGE
Let’s Take a Closer Look
No words. No numbers. No graphs. Just a series of colored bars.


These “climate stripes” are visual representations of temperatures in the Chugach since 1900. Each band represents the average temperature for a single year, relative to the average temperature from 1900 to 2022. The shade corresponds to the rank of each year from coldest—dark blue—to warmest—bright red. The warming trend in the Chugach is remarkable. The numerous and consistently bright red stripes on the right show the undeniable warming trend in the Chugach region over the past three decades.
DATA SOURCE: analyzed and provided by Rick Thoman from the Alaska Center for Climate Assessment and Policy
Climate
Impacts
Dashboard
The Chugach region is witnessing dramatic environmental changes, from retreating glaciers to more intense storms and shifting precipitation patterns. These changes affect our daily lives, from the availability of fresh water to the health of fish and wildlife habitats, and even the risk of landslides and floods. Dive into our interactive maps and charts to see how these changes impact your community and discover what the future might hold.
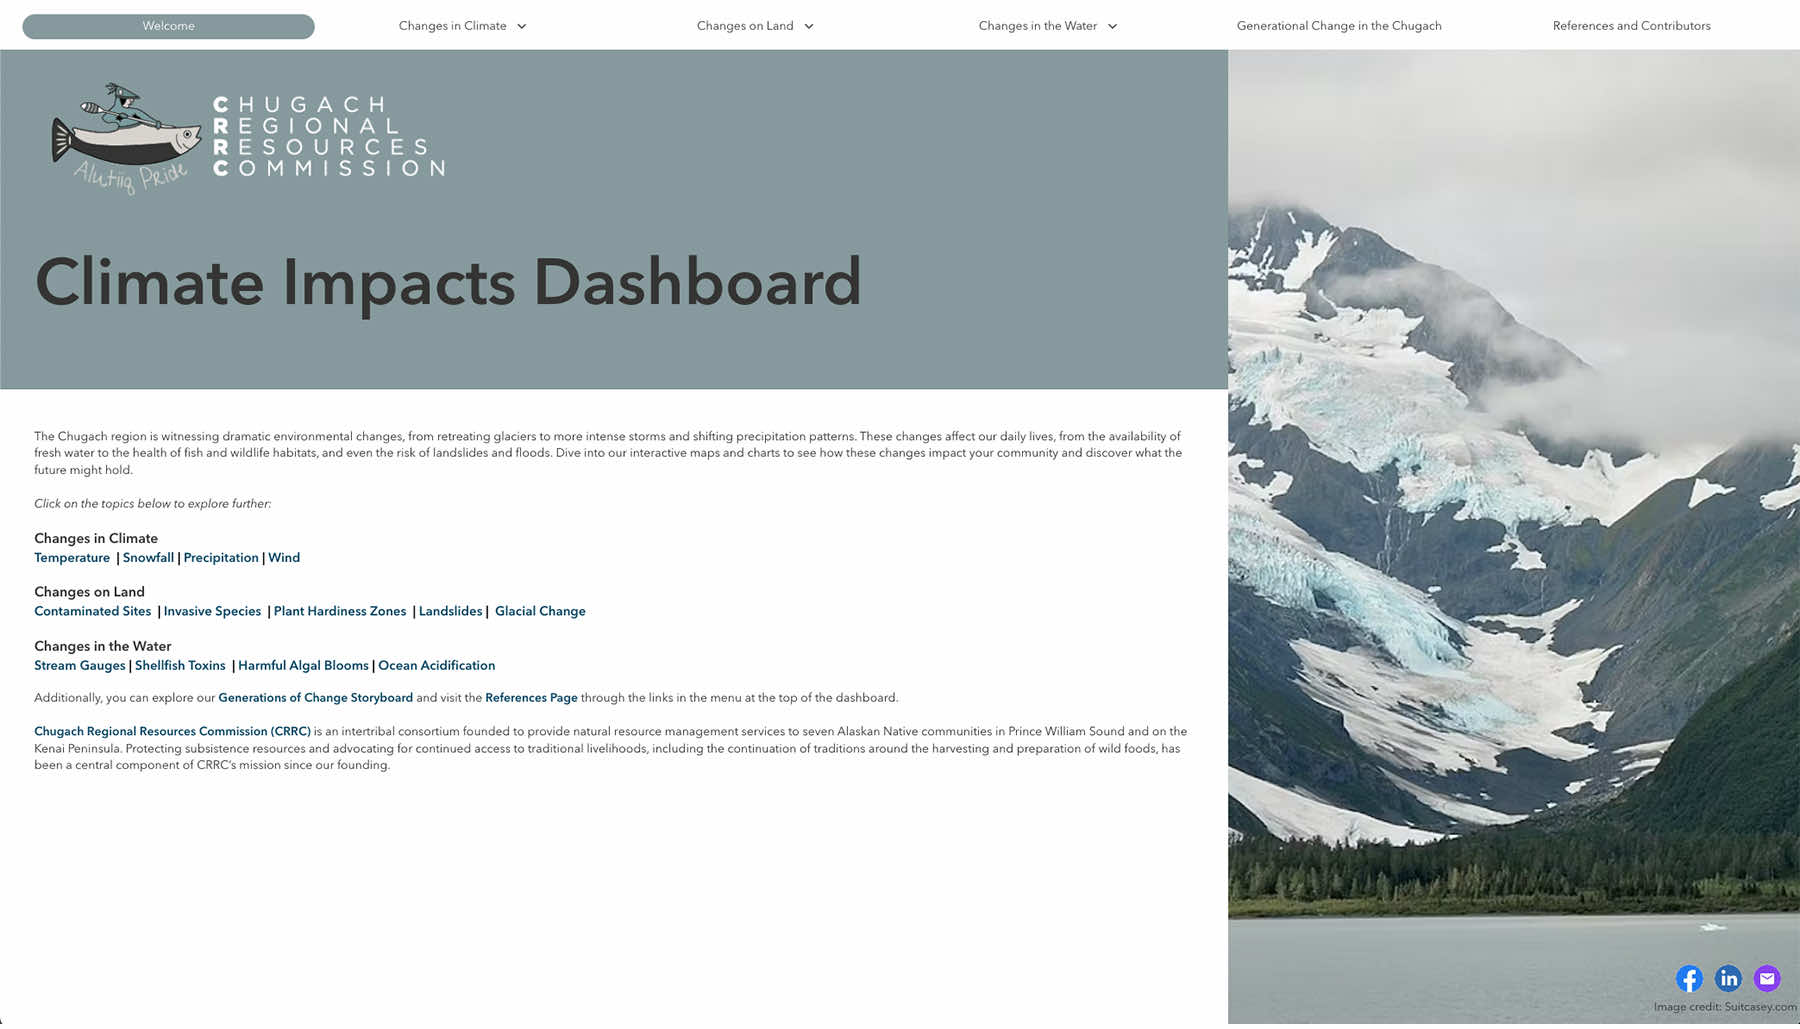

Click on the topics below to explore further:
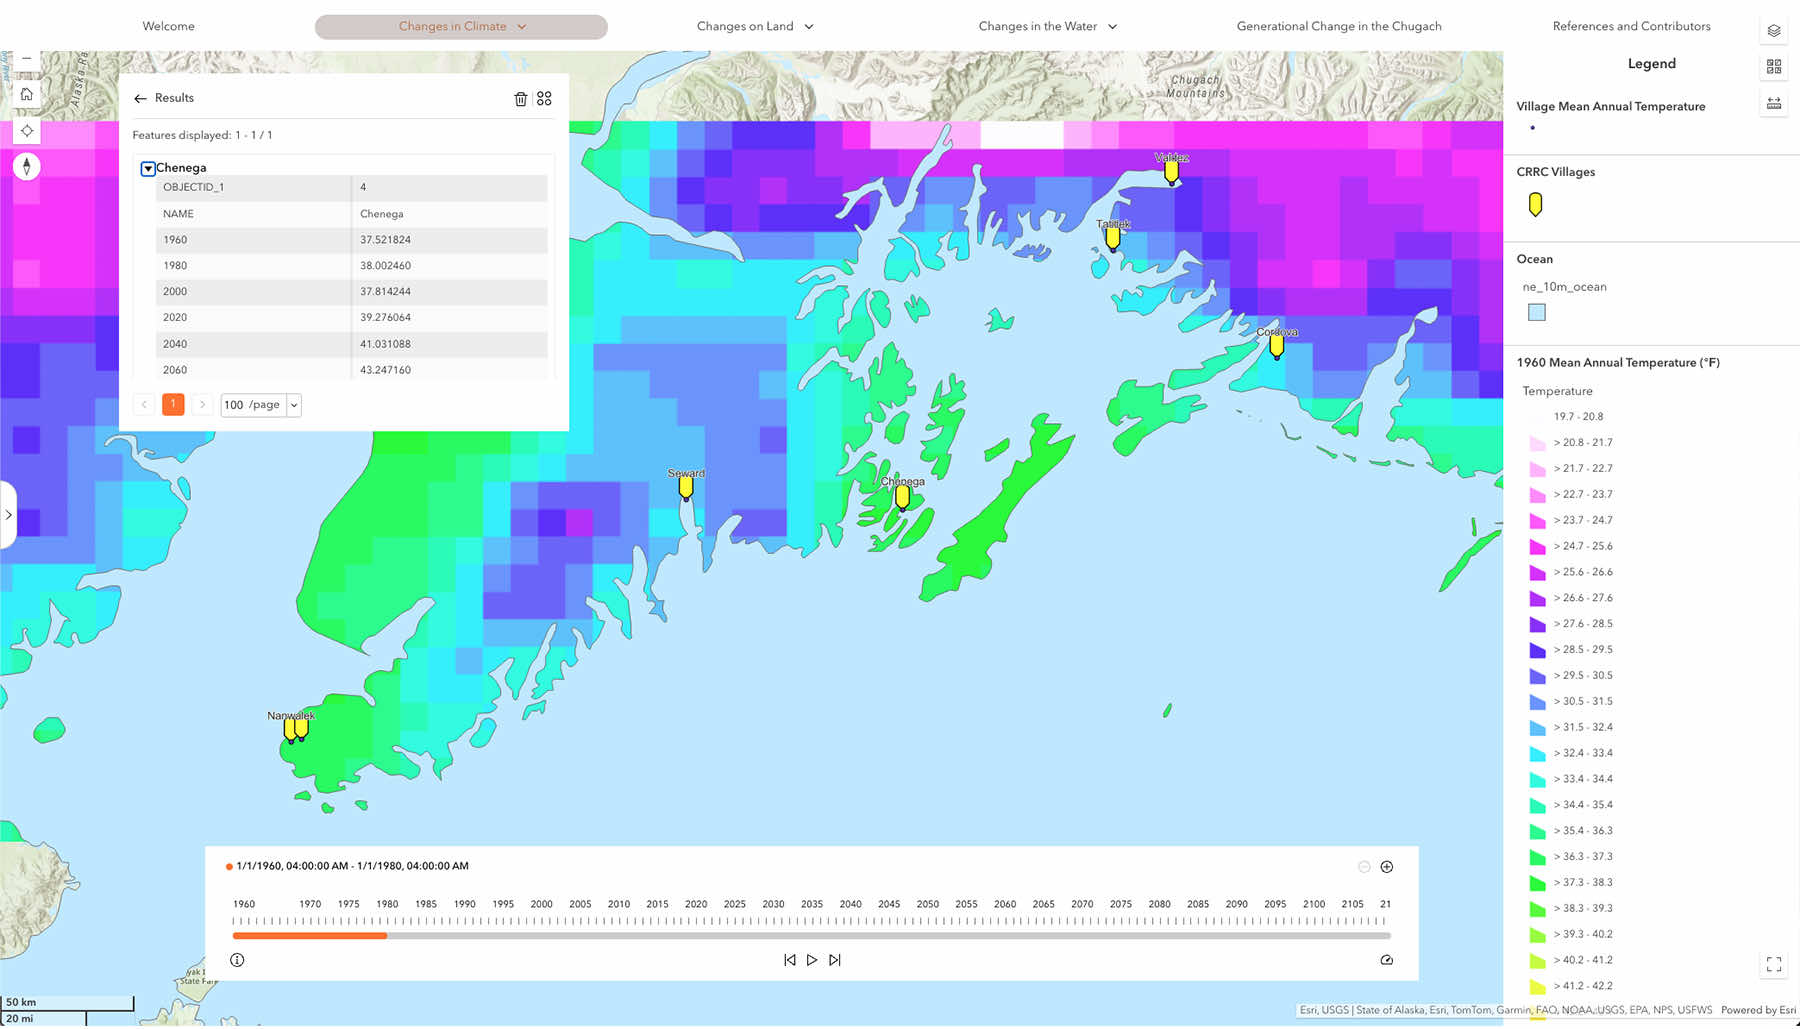
Changes in Climate
Temperature | Snowfall | Precipitation | Wind
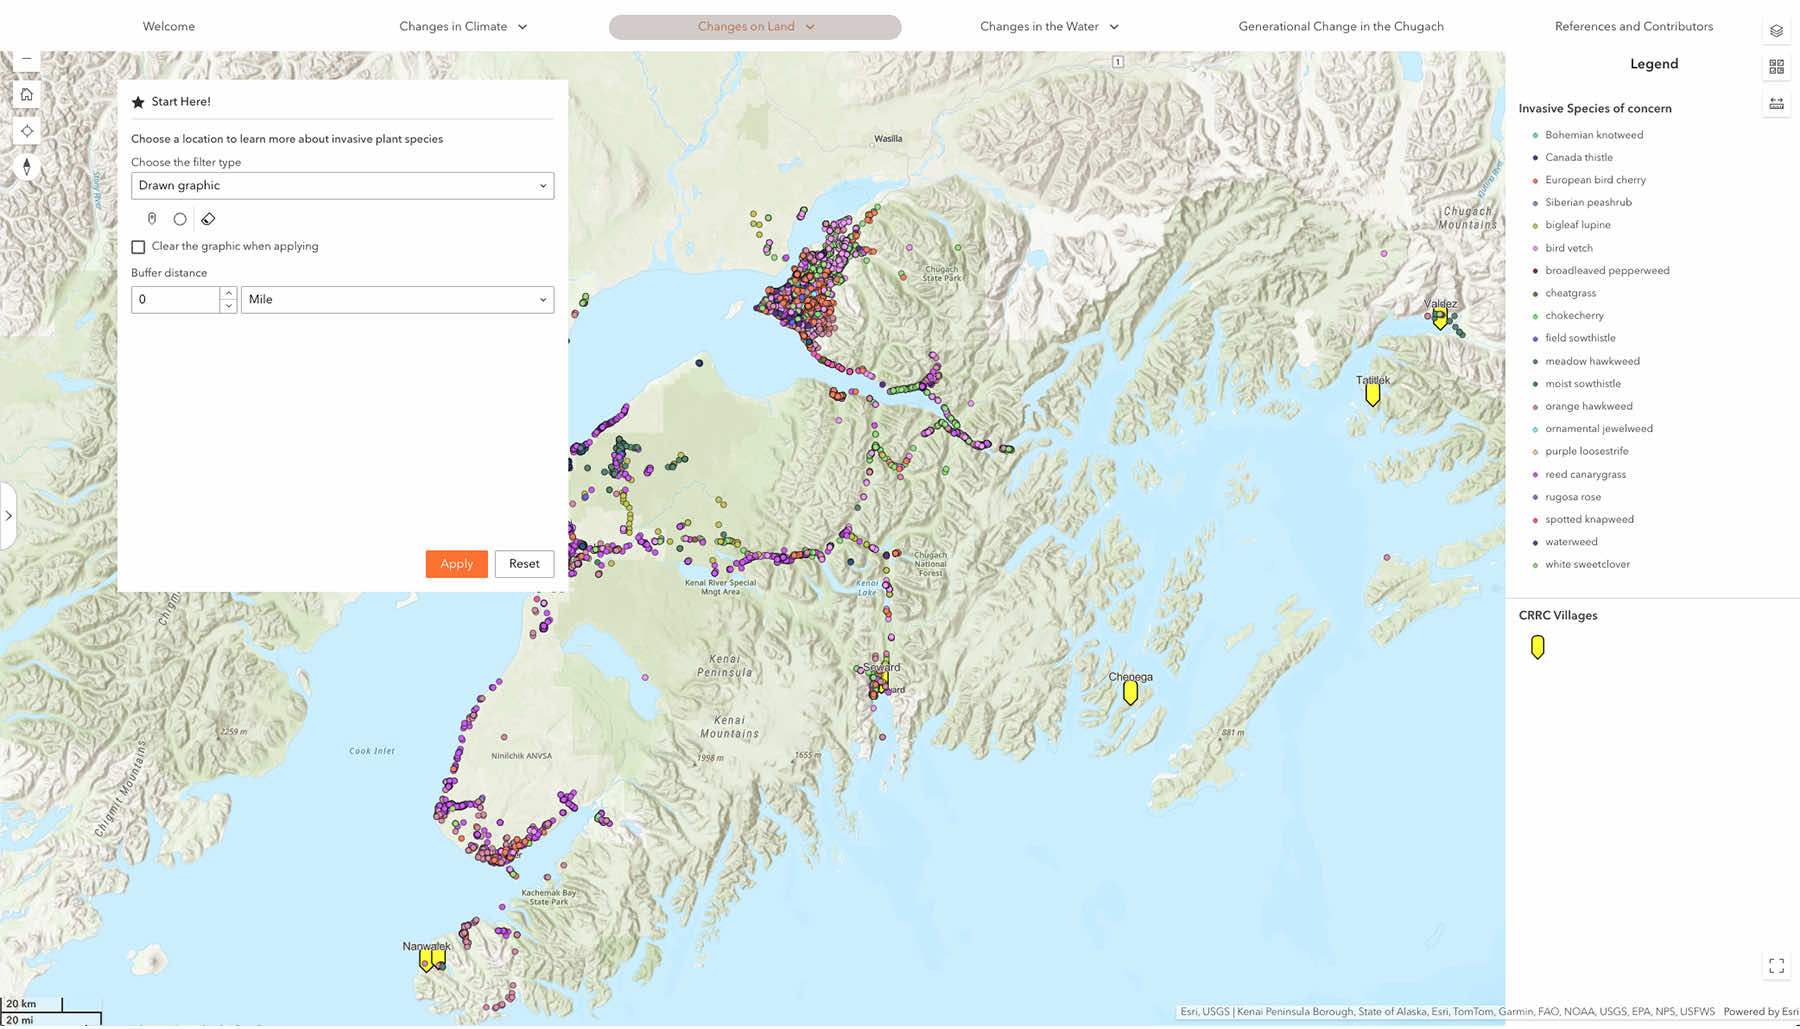
Changes on Land
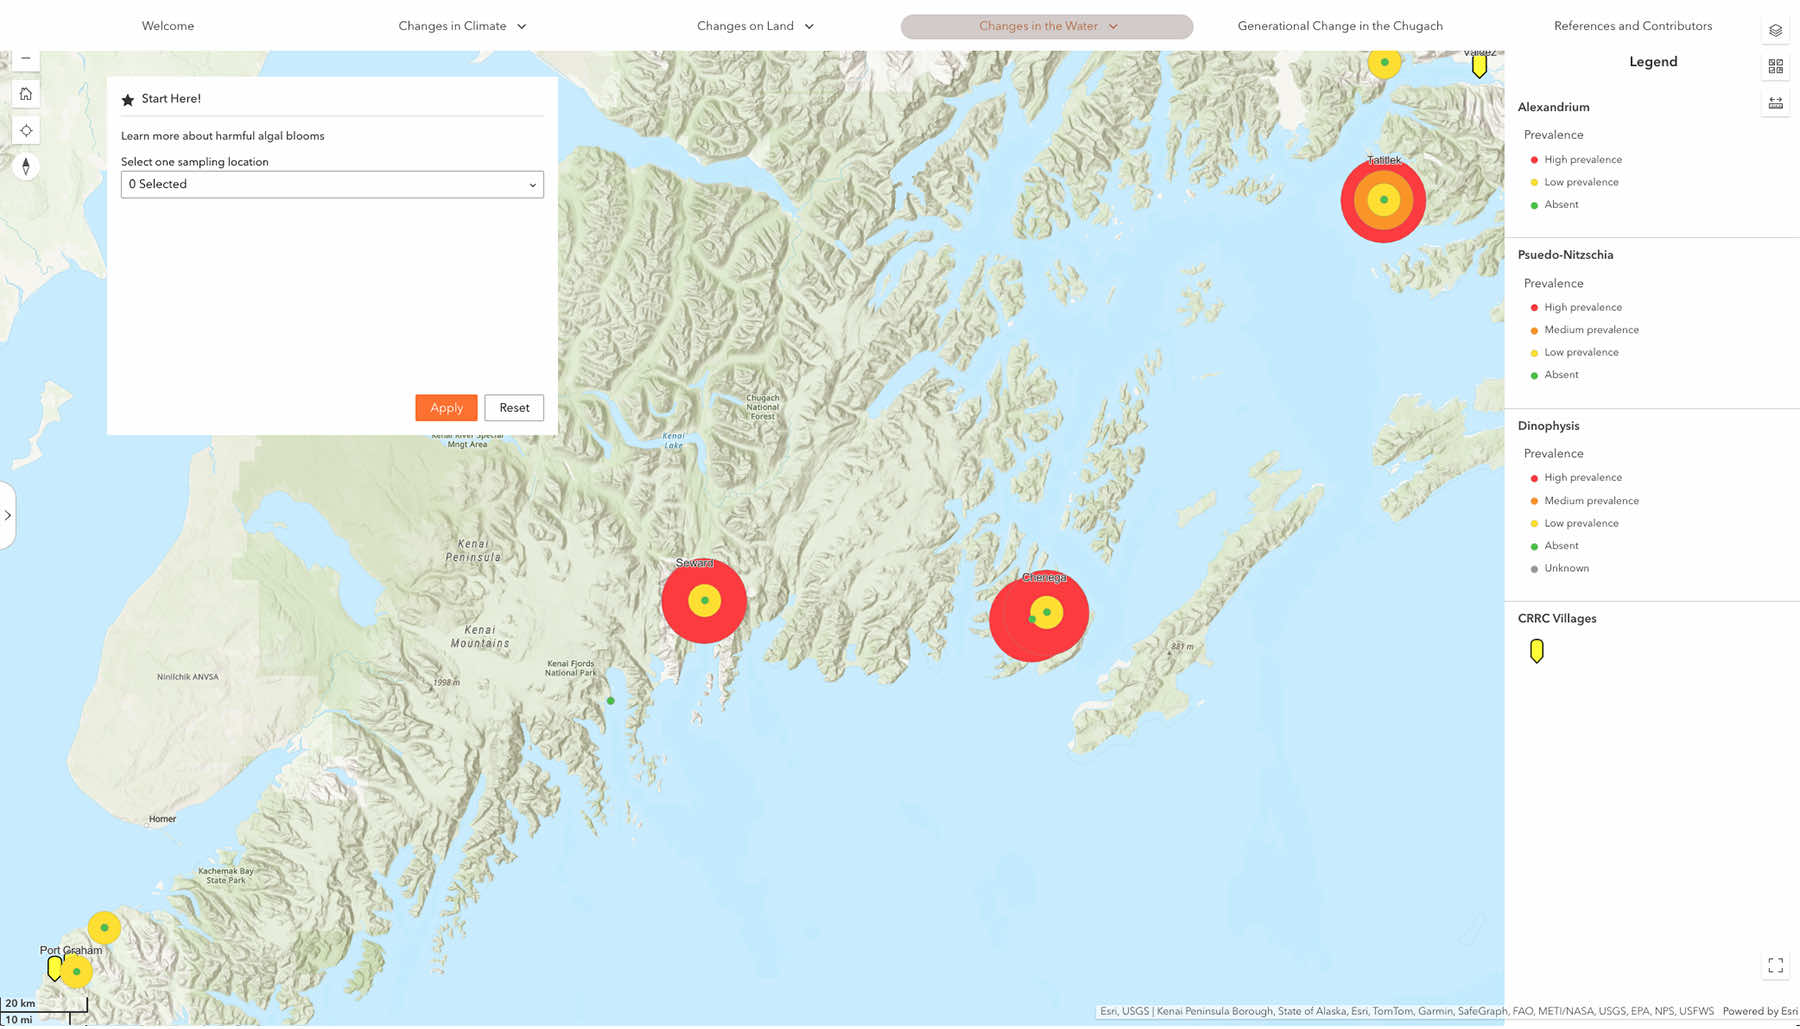
Changes in the Water

7 Generations of Change StoryMap
Human Experiences of Climate Change in the Chugach region
This online tool showcases generations of change in the Chugach, beginning with Lily, a youth from the Chugach region. Learn about local environmental impacts, shifts in temperature, changes in subsistence resources, and more through the story of Lily, her ancestors, and her descendants.
This StoryMap is a resource to share information about local climate impacts, provide downscaled models of climate change to help inform future planning, and to put a human and environmental face to this data to tell the story of how climate change is impacting our region.
Effects of Climate Change & Ocean Acidification
Ocean acidification threatens many of the ecosystems and resources upon which Chugach Tribal Members depend. Colder waters accumulate more carbon dioxide than warmer waters, making our oceans more acidic than the global average. Worldwide, oceans have increased in acidity by 30 percent over the last 250 years as they absorb carbon dioxide from the atmosphere, and future projections show a potential annual increase of 0.5 to1% in acidity.
Currents, freshwater input, and tidal movement cause wide variability in local levels of ocean acidification in Southcentral Alaska, but levels have been steadily increasing over time. Ocean acidification has many impacts on traditional foods, particularly shellfish, as carbon dioxide creates carbonic acid in water, which binds with the carbonate ions shellfish need to produce shells. More information about ocean acidification can be found on the APMI website.
Vulnerability of Traditional Foods
and Food Systems to the Impacts of
Climate Change in the Chugach Region

The Chugach region encompasses seven Sugpiaq and dAXunhyuu (Eyak) communities in Prince William Sound and the southern Kenai Peninsula. This report is a compilation of traditional knowledge and observations by surveyed Tribal members regarding the status of many of the traditional subsistence resources upon which they rely. Respondents considered how a changing climate may be making salmon, non-salmon fish, marine invertebrates, marine mammals, land mammals, birds and eggs, and plants and berries more vulnerable in the Chugach region. Respondents further considered how these changes will impact their livelihoods, including the food and economic security for themselves and their communities. These observations were contrasted with historical subsistence harvest data collected by the Alaska Department of Fish and Game. This is one of several documents that will be used to help guide adaptive responses to strengthen environmental and social resilience in the Chugach region.

2024 Chugach Region Climate Resiliency Strategy
Recommendations from the Tribal Climate Cohort
